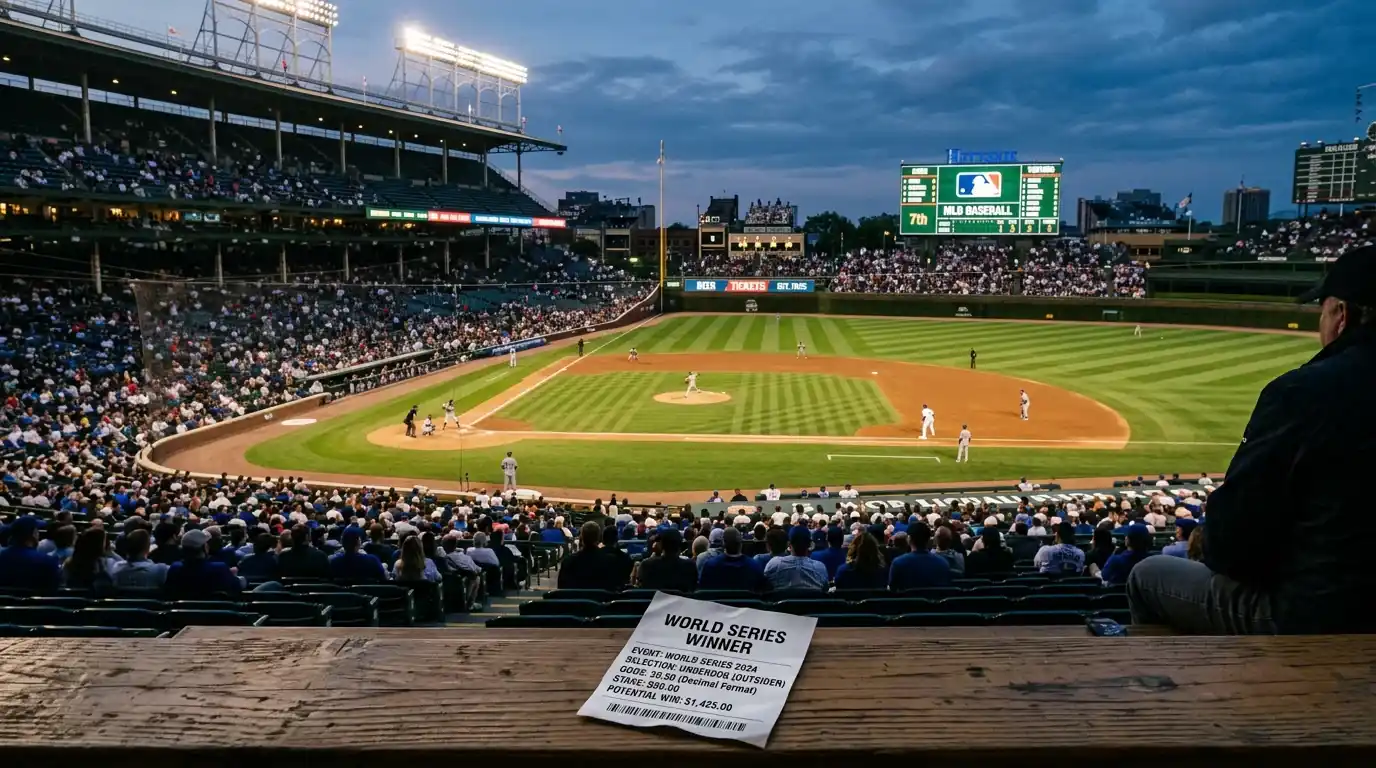
MLB Pitcher Strikeout Props: Evaluating Whiff Rates
 Available in US
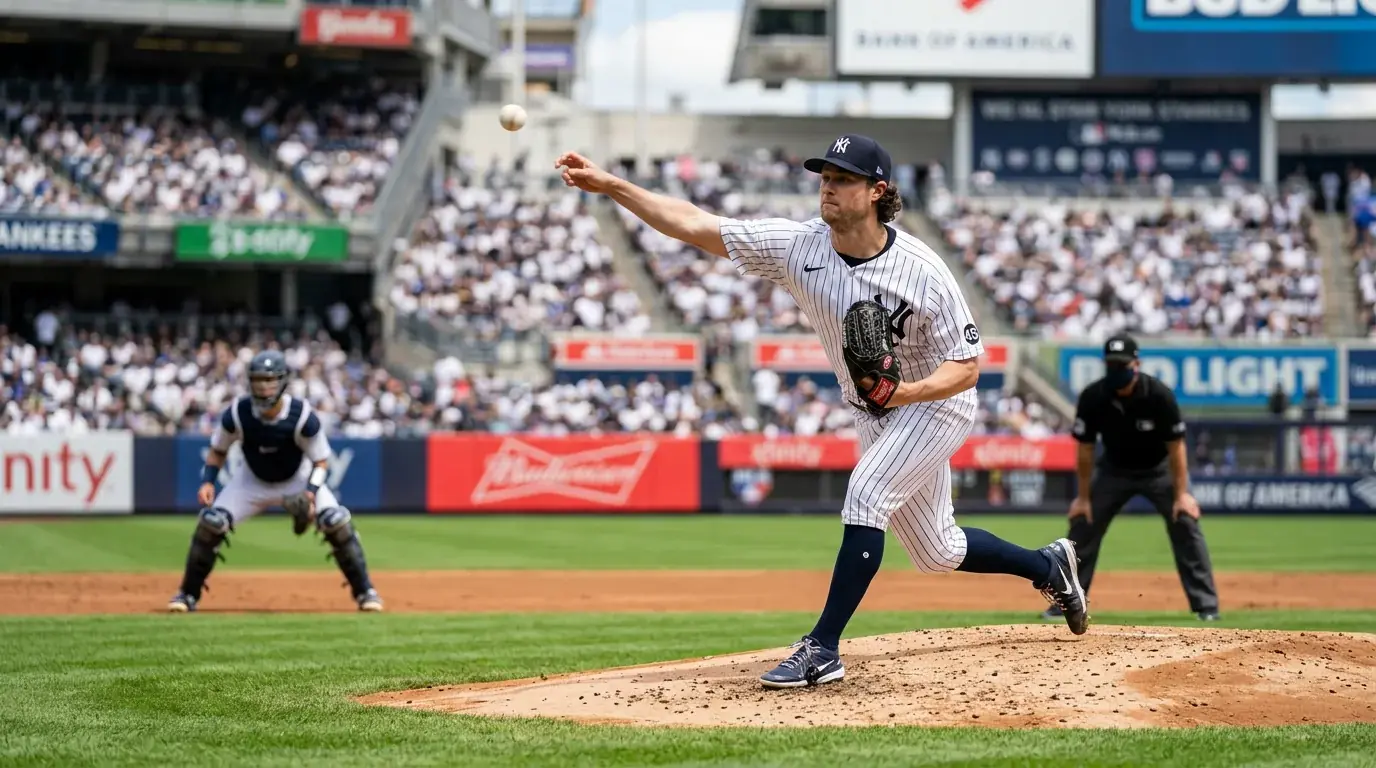
MLB Strikeout Odds: Pitch Count and K% Analysis
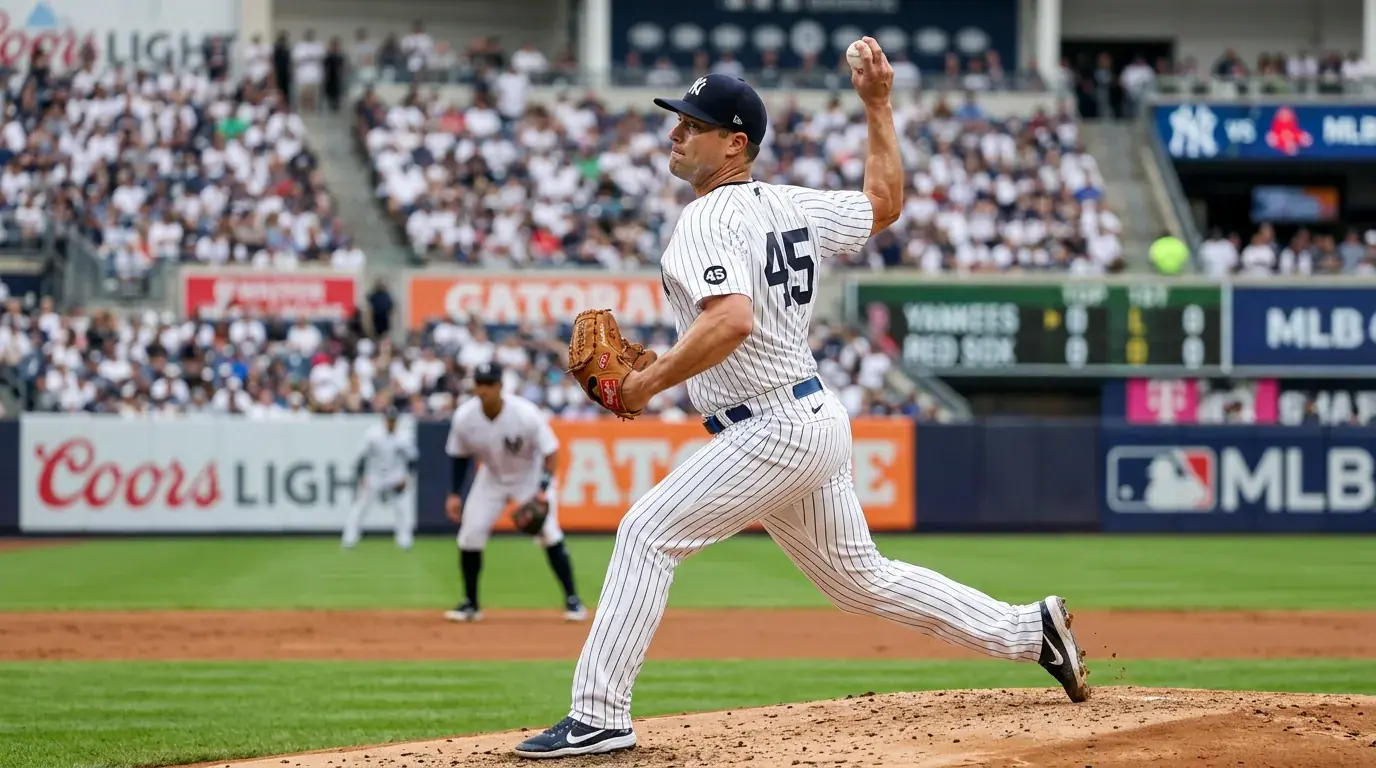
The first time I cashed a strikeout prop without watching a single inning, I realised the market had less to do with the eye test than with maths. The starter had a 31 % whiff rate, was scheduled to face a free-swinging lineup, and was running a 95-pitch leash on a routine start. The over at 7.5 strikeouts settled in his fifth inning. I never saw it happen – I had already gone to bed. The model had done the work.
A strikeout prop is fundamentally a volume bet. You are not betting on whether a starter is good; you are betting on whether the combination of his strikeout rate and his expected innings load produces enough strikeouts to clear the line. Two starters with identical season K% can have wildly different prop expectations on a given night because one is going to throw 100 pitches and the other 75. Volume drives the bet, and reading volume correctly is most of the work.
K% and Whiff Rate: The Two Anchor Stats
League-average K% sat at 22.2 % in the last full season I tracked, with BB% at 8.4 %. That benchmark matters because every strikeout-prop decision starts with a comparison to it. A starter at 28 % K is well above league, and his strikeout-prop totals are priced accordingly; a starter at 18 % K is below league, and his prop totals will be set lower. The line itself usually reflects the K rate, so the K rate alone rarely creates value – it just tells you whether you’re in the conversation.
The stat that creates value is whiff rate, which is a finer-grained measurement. Whiff rate is swings-and-misses as a percentage of total swings, not as a percentage of total plate appearances. A starter with a 32 % whiff rate is generating swing-and-miss on nearly one in three swings against him – that is elite, and it usually translates to actual strikeouts at a higher conversion rate than his K% headline suggests when matched against a free-swinging lineup. The K% is a season-long aggregate; the whiff rate, paired with opposing-lineup discipline, is the predictor for any given night.
Pitch-mix matters in concert with whiff rate. A starter who generates whiffs primarily with breaking balls – sliders, curves, splitters – is more vulnerable to lineups that lay off non-fastballs early in the count. A starter who generates whiffs with a high-velocity four-seam fastball at the top of the zone is harder to game-plan against, because hitters cannot simply spit on a 97-mph heater. The whiff-rate-by-pitch breakdown is publicly available on Baseball Savant and takes about ninety seconds per starter to read.
I also weight first-pitch strike rate. A starter who pumps strike one at a 65 % rate is consistently working ahead in the count, where his out pitches are most effective. A starter at 55 % first-pitch strike rate is constantly behind, throwing fastballs to get back into the at-bat, and missing fewer bats. League average sits near 60 %.
Pitch-Count Cap and the Innings Ceiling
The prop line on strikeouts is set assuming the starter pitches roughly six innings. If he pitches five, the over is in trouble; if he pitches seven, the over is essentially guaranteed for any starter near or above league-average K rate. The pitch-count cap is therefore the second-most-important variable in the bet, and it is the one most casual punters under-weight.
I keep mental notes on every starter’s typical leash. Some starters routinely throw 100-110 pitches; others get pulled at 85 like clockwork. A starter on a 90-pitch leash who throws inefficiently – many three-ball counts, many foul-offs – will be lifted in the fifth or sixth inning before the strikeout volume materialises. A starter on the same 90-pitch leash who works efficiently can complete seven innings. Same starter, same line, two different probability environments.
Recent injury history compresses the cap. A starter returning from any IL stint is on a softer leash for four to six starts, often capped at 80-85 pitches regardless of game state. Strikeout-prop overs on returning-from-IL starters at lines that assume normal six-inning workloads are systematic traps. I have lost money on this exact pattern enough times to file it permanently.
The pitch clock changed the game-time picture, not the pitch-count picture. Pitches per inning have stayed roughly stable; total game time has dropped from longer averages to recent figures hovering around 2 hours 36-40 minutes. As David Langton’s Clemson University analysis put it, pitching statistics were not significantly affected by the rule change, including elbow injuries – in fact, home runs and walks both dropped meaningfully across the league. That stability is good news for strikeout-prop modelling: the underlying physics of K rate per nine innings is unchanged. What changed is the surrounding context, not the pitcher’s strike-zone behaviour. For a deeper read on how the pitch-clock effect on totals shapes the broader betting picture, the surrounding analysis matters.
Bullpen-day starters and openers are a special case. A starter slated for two innings as an opener should never be considered for a normal strikeout-prop line; the line itself usually drops to 3.5 or below to compensate, but the volatility around that smaller number is brutal. I avoid opener starts entirely on strikeout props, because the variance is unpaid.
Opponent Lineup K% as the Multiplier
The third leg of the strikeout-prop tripod is the opposing lineup’s strikeout rate. League-average team K% sits near 22.2 %, but the spread across teams is meaningful – some lineups punch out 26 % of the time, others under 19 %. That 7-point spread is enormous when applied to twenty-five plate appearances across six innings. A 26 % K-rate lineup gives a starter roughly 6.5 strikeouts on volume alone; a 19 % K-rate lineup gives him 4.75 on the same volume. That difference flips a 7.5 line from comfortable over to comfortable under.
I cross-reference team K rate with handedness splits. Some lineups are league average overall but strikeout-prone against right-handed starters specifically, or against breaking-ball-heavy starters. The split that matters is opponent K% against the pitcher type you are about to back, not the headline number.
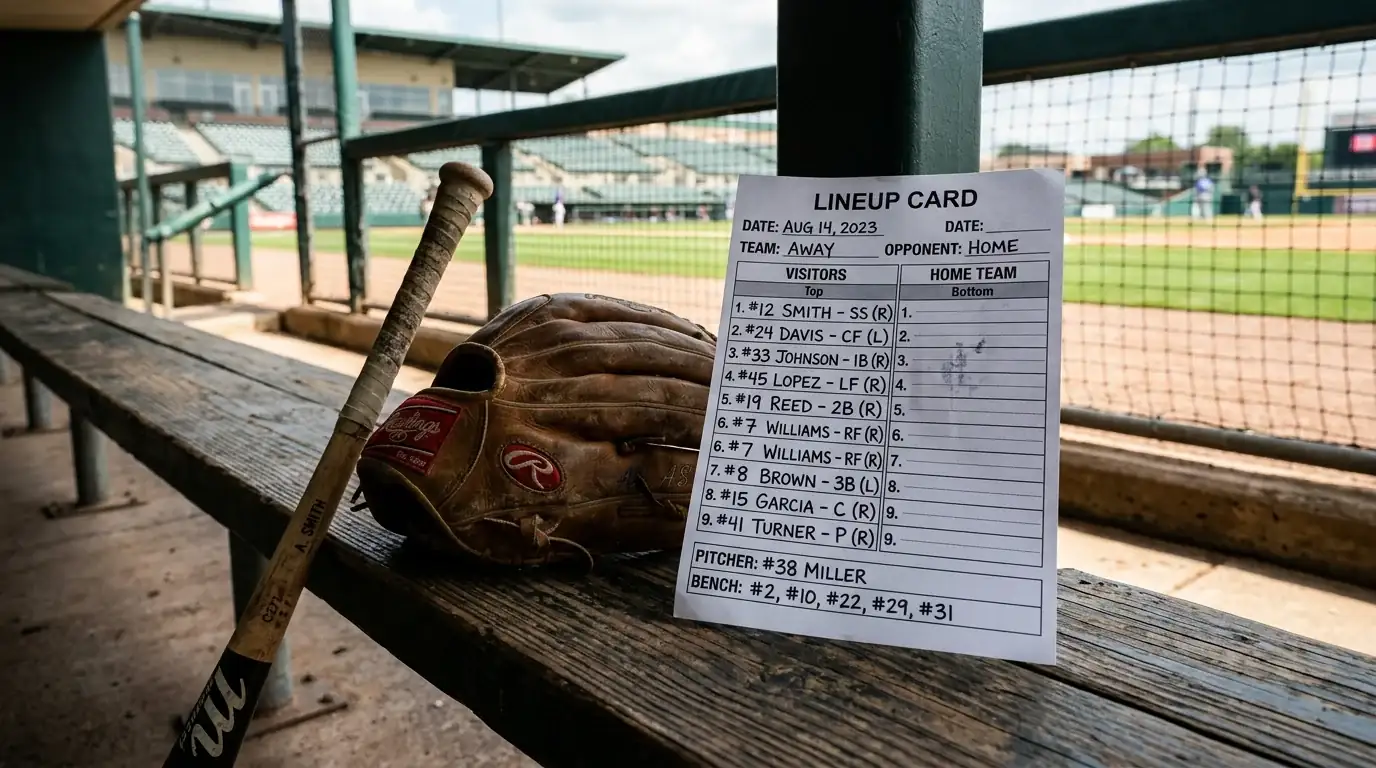
The leadoff and two-hole specifically are the leverage points. If a lineup’s top two batters are contact-first guys with sub-20 % K rates, they extend the inning, see more pitches, and drag the starter’s pitch count up while suppressing his K total. The same lineup with two power-first leadoffs at 28 % K rates is a strikeout buffet – the starter ramps his pitch count to the mid-90s by inning five, but his K total has already cleared.
Recent form on the lineup side matters but with caveats. A lineup that has struck out at a 30 % rate over the past week is not necessarily a 30 % K lineup going forward; small samples regress toward the season norm. The trick is reading whether the recent surge or slump in K rate is structural – a regular missing time, a hot starter pulling them up – or noise. The base rate is the season number; the adjustment is the recent context.
Worked Example: Over 7.5 Ks in Decimal Odds
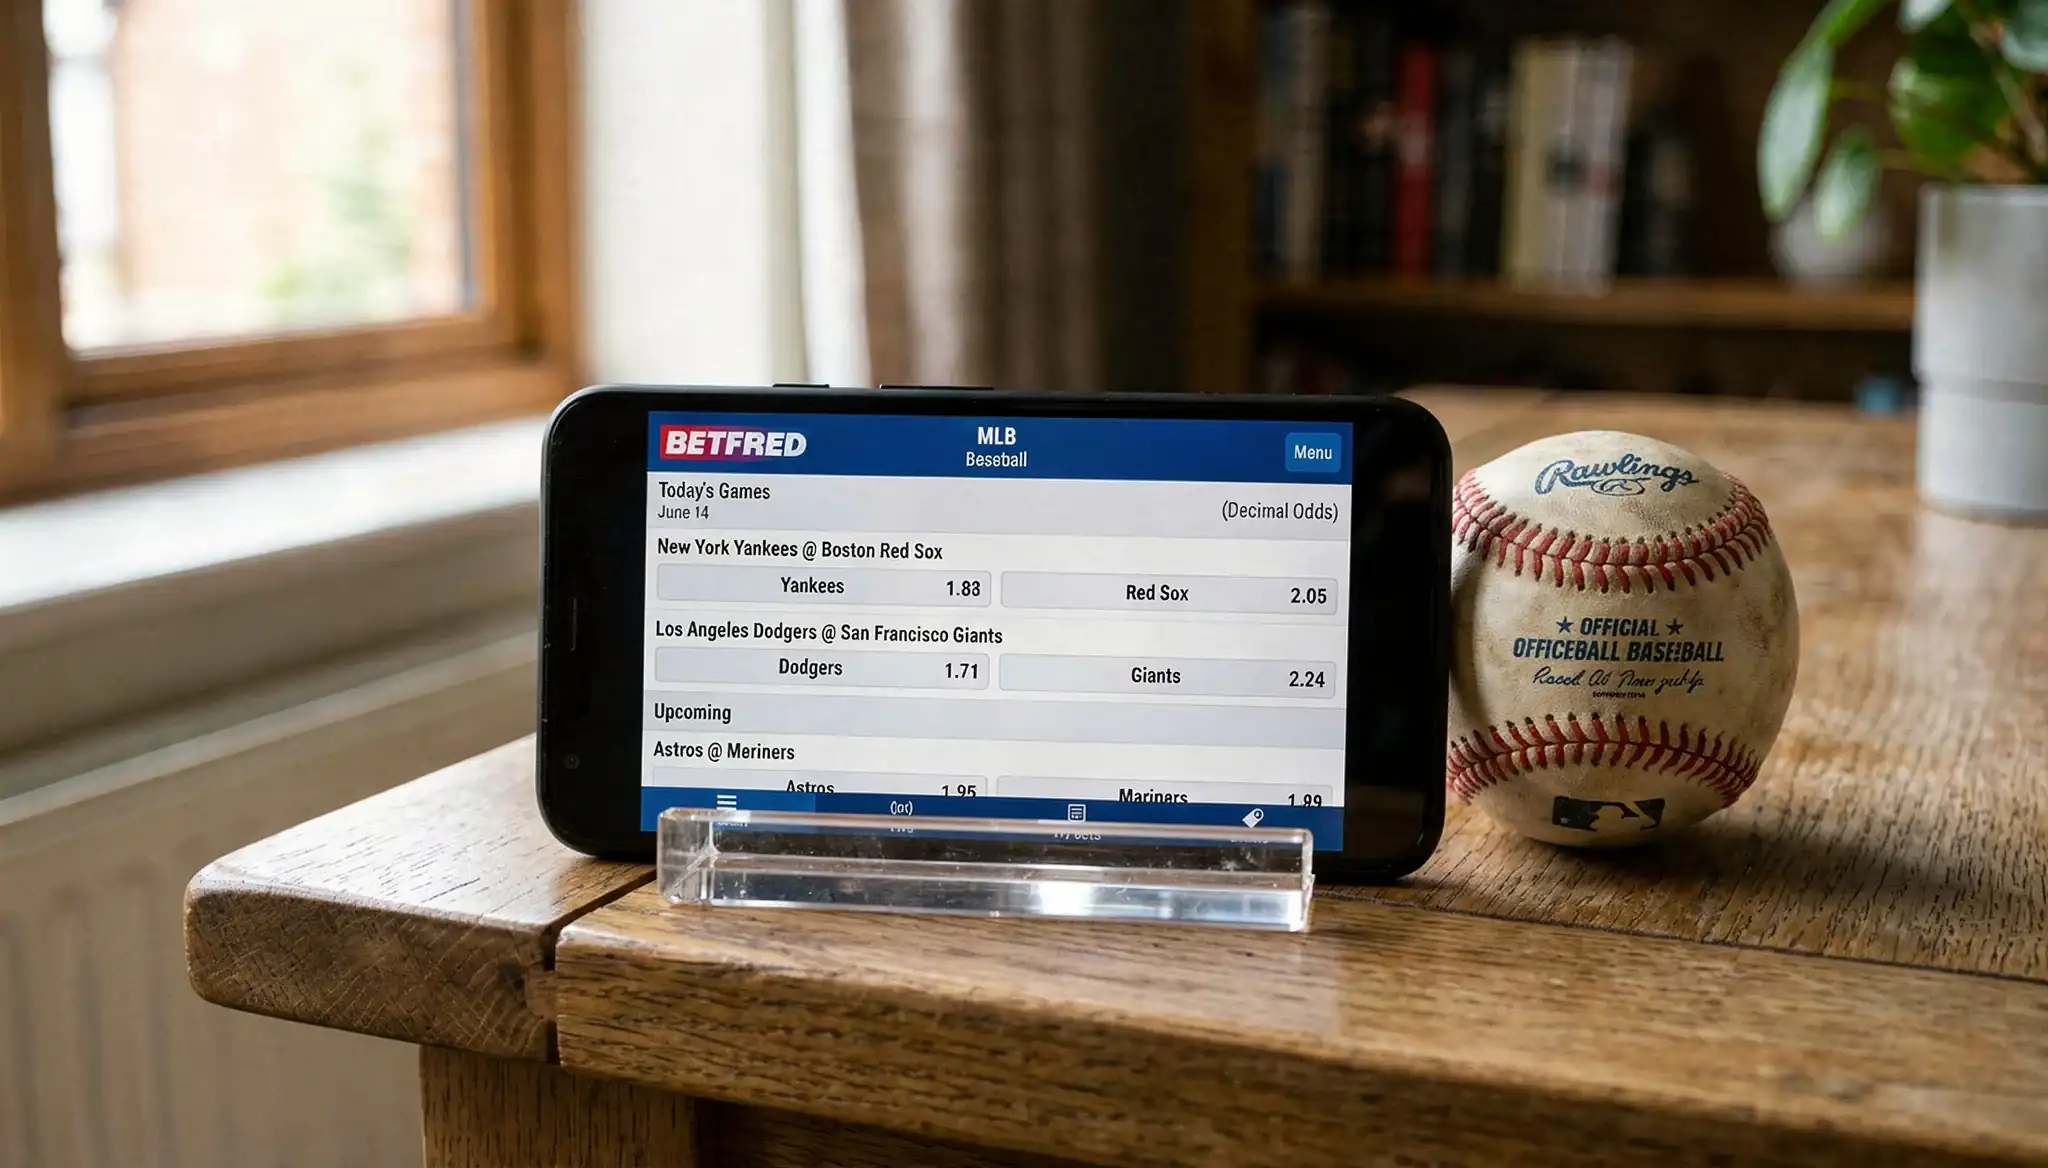
Take a starter with a season K% of 28.4, whiff rate 31 %, first-pitch strike rate 64 %, on a 100-pitch leash and averaging six-and-a-third innings per start over his last five outings. He faces a lineup with a 24 % team K rate and a tendency to chase breaking balls late in counts. Park-neutral, light wind. The over-7.5 strikeouts prop opens at 1.85.
Implied probability at 1.85 is 1 ÷ 1.85 = 0.541, or 54.1 %. I build my own. Six-and-a-third innings produces roughly twenty-five plate appearances. A 28 % K rate against a 24 % K lineup, weighted toward the higher of the two given the starter’s whiff-rate signature, produces an expected K count near 7.6. The probability of clearing 7.5 – that is, recording 8 or more – given a Poisson-style distribution around 7.6, is approximately 58-62 %.
That is real daylight over the 54.1 % implied. A £20 stake at 1.85 returns £37, with £17 profit, on an event that should occur roughly 60 % of the time. I would size this at 1 unit and revisit if the line moved against me before first pitch. I would skip the bet entirely if either the lineup news brought in a contact specialist at the top of the order, or the starter’s pre-game velocity was reported a tick below his average.
One last calibration: I never stake more on a strikeout prop than I would on the equivalent moneyline. The K-prop is a derivative bet, and treating it as the primary position rather than as a side adjacent to a primary position is how amateurs over-weight a single number. The starter’s expected innings, the opposing-lineup K rate, and the pitch-count cap should all align – if even one of the three is unfavourable, the price has to be substantially better than implied to justify the stake.
Strikeout-Prop Questions UK Bettors Ask
The questions I see most on this market are mechanical. Punters want to know what the pitch clock has done to the data, and they want a working K% number to anchor against. Both deserve direct answers, because both questions are downstream of a single bigger question – what is the modern baseline?
How does the pitch-clock rule affect strikeout-prop totals?
The pitch-clock rule, fully implemented from 2023, has had a smaller effect on strikeout rates than on game length. Pitches per inning have stayed roughly stable, while total game time dropped to recent averages near 2 hours 36-40 minutes. Empirical analysis from Clemson University found that walks dropped by roughly eleven per pitcher per season and home runs by four, with strikeout rates not significantly altered. UK sportsbooks have re-calibrated strikeout-prop totals since 2023, but stale prices on returning-from-IL starters can still create value.
What K% threshold makes an over-bet realistic on a 6.5 strikeout line?
A starter at or above 25 % K rate against a lineup at or above league-average team K rate of 22.2 %, going six innings on a normal pitch-count leash, is the working baseline for an over-6.5 strikeout prop. Below 25 % K rate the bet relies on the lineup matchup specifically and is a thinner edge. Whiff rate above 28 %, first-pitch strike rate above 60 % and a confirmed 95-105 pitch ceiling round out the criteria.
Written by the editors at Betting on Baseball Tips.