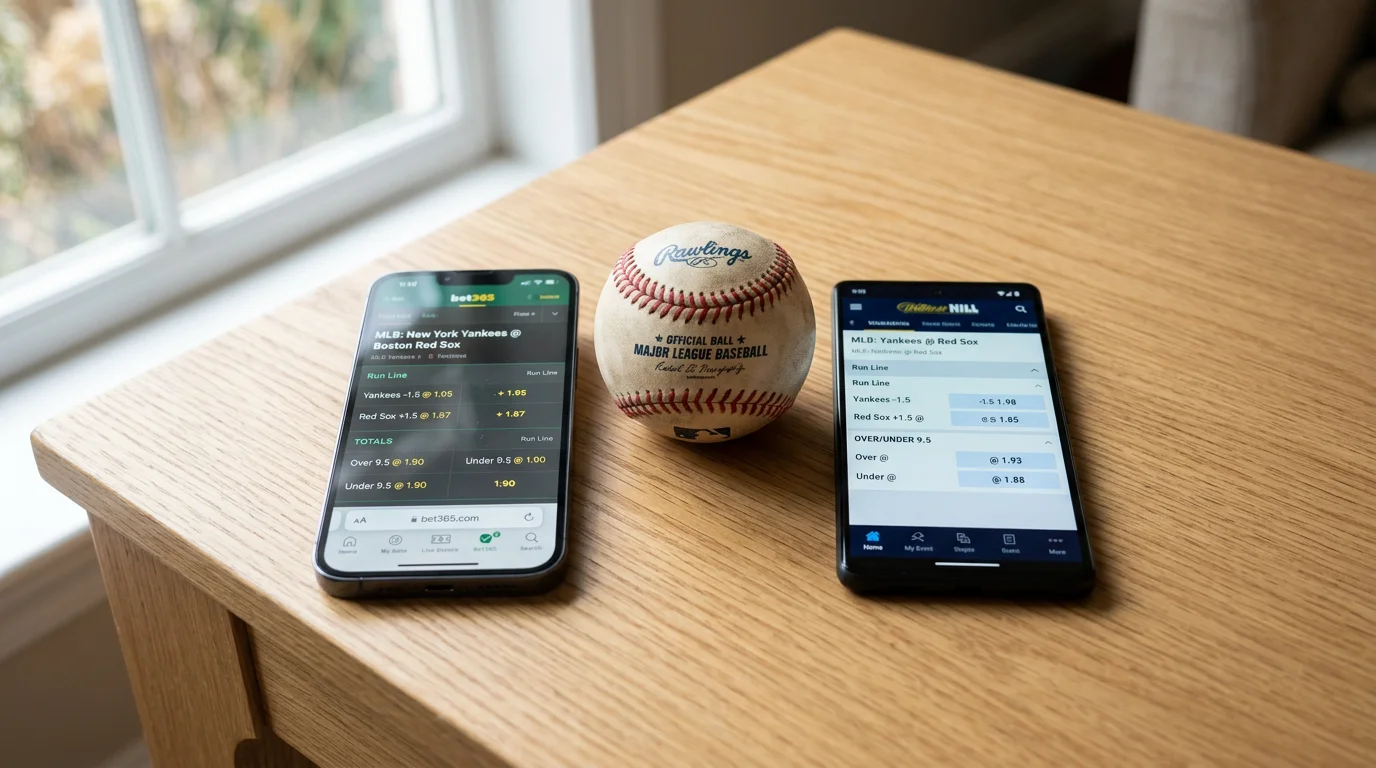
Bullpen ERA MLB Betting: Late-Innings Value
 Available in US

MLB Bullpen ERA: Forecasting Late-Innings Run Lines
The single most underpriced input on a UK MLB betting slip is rolling bullpen ERA. Punters spend hours studying starting-pitcher matchups, lineup composition, ballpark factors, weather. Then a starter exits in the sixth inning and the entire pre-match analysis becomes irrelevant. The next 12 outs determine the game, and those 12 outs are recorded by relief pitchers whose recent form is the variable that actually decides who wins. I learned this the expensive way across two losing seasons before I built a tracking system around it.
Bullpen ERA differs from individual pitcher ERA in ways that matter for betting. Individual ERA is computed across a season’s worth of innings, often containing data from months earlier when a pitcher’s health, mechanics, or role were different. Rolling bullpen ERA – the past 14 days, the past 30 days, the past 60 days – captures the current state of the unit in a way that aggregated season figures simply cannot. A bullpen with a season ERA of 3.85 might have a 14-day ERA of 5.40 because the closer has been pitching through injury, the setup arm has lost his slider, and the long man has been worked into high-leverage situations. None of that shows up in the season figure. All of it shows up in the rolling figure. And all of it determines whether a UK punter’s late-game position cashes or loses.
This guide pulls apart the bullpen ERA tracking that actually informs late-innings markets, the usage and fatigue patterns that drive variance in the bullpen-quality data, the closer-matchup math that decides save markets, and a worked example of how to integrate bullpen state into a UK in-play decision. The goal is to give the punter the tracking discipline that turns reactive late-innings positions into pre-match advantages.
How to Track Rolling Bullpen ERA
The tracking is mechanical and the inputs are public. The data sources that work for UK punters track bullpen ERA at three rolling windows: 14 days (the freshest signal, but the smallest sample), 30 days (the working window for most pre-match decisions), and 60 days (the structural baseline against which 14-day deviations should be assessed). Most professional baseball-statistics sites provide all three windows on a free or low-cost basis, and UK punters who run season-long MLB tracking are best served by maintaining a personal sheet that pulls those numbers daily.
The signal that matters is the deviation between windows. A bullpen running a 14-day ERA of 5.20 against a 30-day ERA of 3.40 is a bullpen in trouble – recent fatigue, recent injury, or recent role disruption is producing real underperformance that is not yet reflected in the season averages or the betting lines. A bullpen running a 14-day ERA of 2.60 against a 30-day ERA of 3.40 is a bullpen on a hot stretch – usage is sustainable, recent form is solid, and the line should reflect a slight pricing premium that does not always materialise. The deviation, not the absolute number, is what carries the betting signal.
The K%-BB%-LOB% triplet provides the structural underpinning. League-average K% sits at 22.2 percent, BB% at 8.4 percent, LOB% (left-on-base, the rate at which runners on base are stranded without scoring) at 72.3 percent. Bullpen LOB% above 75 percent is a sign of strand luck that will regress; bullpen LOB% below 70 percent is a sign of bad sequencing that should regress upward. UK punters tracking bullpen ERA who also track these underlying rates can identify when ERA is misleading them – a 4.20 bullpen ERA built on a 78 percent LOB% is more concerning than the same ERA built on a 71 percent LOB%, because the first will regress upward as the strand luck normalises.
Usage and Fatigue Patterns
The cumulative workload a bullpen has absorbed over the past three to seven days is the variable that compresses or amplifies the rolling ERA signal. A bullpen that has worked 18 innings across the last six games is approaching fatigue. A bullpen that has worked nine innings in the same window has reserves. The publicly available pitch-count data shows which arms have thrown how many pitches over which game windows, and that data is published before first pitch – UK punters checking the pre-match feeds three to four hours before the game capture the workload picture.
Three patterns repeatedly drive variance in bullpen performance. The first is consecutive-day usage on the closer. A closer who has appeared in three of the last four games is operating at degraded velocity and command, and the save market in his next appearance prices in only part of that degradation. UK punters laying the under on an opposing-team total in those scenarios capture an edge – the closer entering the ninth inning at less than full effectiveness gives up runs that are not being priced in. The second pattern is the long-relief usage. Bullpens forced to absorb six or more innings in a single game (because of a starter implosion or extra innings) carry that fatigue into the next 48 to 72 hours. The pricing on the next two fixtures often does not adjust for the carry-over.
The third pattern is the off-day reset. Bullpens emerging from a scheduled off-day are at maximum freshness, and pricing on the post-off-day fixture often underweights this freshness because the public is focused on the starting pitcher matchup. The aggregate run environment in MLB sits around 9.2 combined runs per game in the post-pitch-clock era, but post-off-day games for the rested bullpen consistently underperform that average by 0.3 to 0.5 runs across multi-season samples. UK punters laying unders on post-off-day fixtures with strong starting pitching capture this systematically.
The relationship between bullpen usage and game-script also matters. A blowout that empties the lower-leverage arms of the bullpen does not fatigue the closer or setup arms, so the next-game closer market is unaffected. A close one-run game that uses the closer, the setup, and the right-handed specialist does fatigue the high-leverage arms, and the next-game closer market should be priced accordingly. The bullpen-quality input is conditional on game-script, not absolute. A useful framing for the UK punter who wants to extend the bullpen-state thinking into pre-match positioning sits in the F5 alternative for bullpen risk approach.
Closer Matchups and the Save Market
The save market is where bullpen ERA most directly translates to a betting position. UK books offer outright save markets on a per-game basis, and the pricing varies substantially by closer. An elite closer (rolling 14-day ERA below 2.50, K% above 28 percent) at decimal 1.36 to 1.42 is generally fair value. A struggling closer (14-day ERA above 4.50, BB% above 11 percent) at decimal 1.50 to 1.65 is generally overpriced – the implied probability of conversion does not match the underlying rate.
The save-market edge sits in the middle of the closer-quality distribution. Closers running 14-day ERAs in the 3.00 to 3.80 range are the population where market mispricing concentrates. The line moves slowly when a closer’s form is gradually deteriorating, and a UK punter watching for the underlying signal – rising BB%, declining velocity, increased home-run rate – can lay the no-save position at favourable prices before the market catches up. The reverse position (laying the save on a closer whose underlying rates are improving but whose ERA has not yet adjusted) is the same edge in reverse.
The matchup component compounds the closer-quality input. A closer who runs strong vs right-handed hitters but struggles vs left-handed hitters is a different value proposition depending on the opposing lineup’s three-four-five hitter handedness. UK books price the save market off aggregated quality figures and rarely adjust for matchup-specific handedness exposure. The punter who checks the lineup card 30 minutes before first pitch and identifies a left-handed-heavy heart of the order facing a right-handed-vulnerable closer captures an edge that the broad market has not priced.
A Worked Example
Consider a Yankees-Astros fixture where the posted full-game total is 8.5 runs at 1.91 over and 1.91 under. Pre-match starting-pitcher analysis suggests the matchup is roughly neutral on starter quality. The standard analytical approach would treat the total as fair.
The bullpen check tells a different story. Yankees bullpen 14-day ERA: 4.85, against a 30-day ERA of 3.60. Recent usage shows the closer has worked three of the last four days, the setup arm has thrown 32 pitches over two of the last three days, and the long man absorbed 4.2 innings two days prior. Astros bullpen 14-day ERA: 2.95, against a 30-day ERA of 3.40, with no significant fatigue indicators and the closer fresh after a two-day off period. The combined bullpen quality differential favours the Astros by approximately 1.4 runs across the back four innings of a typical game.
The starter matchup priced as neutral, but the bullpen differential is meaningful. A position taking the Astros run line at -1.5 (decimal odds typically 2.20 to 2.40 in this scenario) captures the bullpen edge. Alternatively, an over position at 8.5 captures the Yankees bullpen vulnerability – even if both starters cover their innings, the Yankees bullpen giving up runs in innings six through nine produces totals above 8.5 at substantially elevated rates compared to the broad market expectation. £100 staked on the over at 1.91 returns £91 if successful. Hit rates on bullpen-divergent setups of this magnitude run historically in the 56 to 60 percent range – a meaningfully positive expected value.
Bullpen Tracking Questions UK Bettors Ask
Two questions dominate the reader inbox on bullpen tracking. One asks where to find rolling bullpen ERA data from a UK location. The other asks whether closer workload actually moves the run-line price meaningfully. Both deserve direct answers because both shape the discipline.
Where can a UK bettor track rolling bullpen ERA?
Most professional baseball-statistics sites provide bullpen ERA at three rolling windows – 14 days, 30 days, and 60 days – on a free or low-cost basis. The signal that carries the betting weight is the deviation between windows: a bullpen running a 14-day ERA substantially above its 30-day baseline is in trouble, and a bullpen running below its baseline is on a hot stretch. UK punters running season-long MLB tracking are best served by maintaining a personal sheet that pulls these numbers daily, four to six hours before each fixture’s first pitch.
Does a closer’s recent workload move the run-line price?
Yes, but only partially. UK books adjust closer-related pricing in response to extreme usage (three appearances in four days, for instance), but the adjustment typically captures only half to two-thirds of the underlying degradation. A closer at less than full effectiveness in his next appearance gives up runs at rates the market has not fully priced. The save market and the run-line on close-game spreads both move slightly, leaving residual edge for punters who track the workload data systematically rather than reactively.
Written by the editors at Betting on Baseball Tips.