MLB Park Factors and Weather: Analysing Wind and Totals
 Available in US
Table of Contents
- MLB Weather Impact: Pitching Variables and Run Totals
- What a Park Factor Actually Measures
- The Five Most HR-Friendly Parks in 2024–2026
- Pitcher-Friendly Parks: Where Totals Should Drop
- Wind Direction: The Wrigley Field Multiplier
- Temperature, Humidity and Ball Carry
- Domes, Retractable Roofs and Pace-of-Play
- A Pre-Match Weather-and-Park Routine for UK Bettors
- Worked Example: A Wrigley Wind-Out Total
- Park-and-Weather Questions UK Bettors Ask
- Geography Sets the Number, You Read It
MLB Weather Impact: Pitching Variables and Run Totals
Imagine the same starting pitcher throwing the same nine innings on the same evening — once in Los Angeles and once in San Francisco. Same pitches, same locations, same hitter quality on the other side. The expected runs scored differ by almost two. That is the entire premise of park factor work, and it is the reason every total I price starts with the venue, not the rotation.
The numbers behind that gap are not subtle. Dodger Stadium carries an HR Park Factor of 129 across 2024–2026 — meaning home runs there happen about 29 per cent more often than the league baseline. Oracle Park sits at 77, PNC Park at 78, Busch Stadium at 81. The spread between the friendliest and least friendly hitter environments runs wider than 50 percentage points, and it shows up in totals every single night.
The lesson I had to learn the hard way is that park factor is not just an over/under input. It changes what kinds of bets are even worth taking. A 15 per cent Barrel Rate hitter in Oracle Park is not the same prop as the same hitter in Dodger Stadium. A starter with a 4.20 xERA going into Cincinnati’s Great American Ball Park is not the same starter going into Pittsburgh’s PNC. Same arm, same lineup behind him, two completely different markets.
This guide walks through park-and-weather work the way I learned to do it, one variable at a time. We start with what a park factor actually measures, then move through the most HR-friendly parks, the pitcher-friendly ones, the wind effect at Wrigley Field — which deserves its own section because the multiplier is genuinely extreme — temperature and humidity, the way domes and retractable roofs change pace and totals, a pre-match weather routine you can run in five minutes, and a worked example of a Wrigley wind-out total.
One framing point. Park factor and weather are not separate inputs. They interact. A neutral park with the wind blowing out can play like a hitter’s park for a single afternoon. A hitter-friendly park on a cold, damp evening with the wind in can play like a pitcher’s park for nine innings. The skill is in reading both at once.
A perfect example of this environmental impact can be seen when analyzing Wrigley Field wind betting trends during the summer months.
What a Park Factor Actually Measures
Most punters who use the phrase “park factor” treat it as a vibe — Coors Field is hitter-friendly, Petco is pitcher-friendly, Yankee Stadium has a short porch. That intuition is not wrong, but it misses what the number is actually doing. A park factor is a relative index with 100 as the league baseline. A score of 129 means home runs happen 29 per cent more than they would at a league-average park, holding everything else constant.
The “holding everything else constant” matters more than punters realise. Modern park factors, particularly the Statcast-derived ones I use, control for the quality of hitters and pitchers who actually play at the venue. That stops the metric from confusing “this is a great offensive team” with “this park inflates offence.” The Dodger Stadium 129 number is not because the Dodgers hit a lot — it is because, after adjusting for who is batting and pitching there, the venue itself adds 29 per cent to home-run probability.
The factors come in different flavours. HR Park Factor is the one I check first because home runs are the binary outcome that swings totals most decisively. Run Park Factor measures total runs scored at the venue versus league average — slightly different from HR factor, because parks can suppress home runs but inflate doubles and triples (or vice versa). Hits factor, doubles factor, triples factor each exist as separate indices for the prop-bet specialist who needs the granularity. For most over/under work, HR and run factors together cover 90 per cent of the actionable information.
The methodology that makes the Statcast factors trustworthy is a rolling three-year window. That means a 2024–2026 factor is using the actual results across those three seasons, with adjustments for the quality of play. Three years smooths out single-season anomalies — a particularly hot summer, a roster that skewed unusually pull-heavy — without going so deep into history that structural changes get diluted. When a park has a wall renovation, the factor takes a year or two to fully absorb the change.
The trap is treating the factor as a fixed number. Park factor is a season-long average. Within a season, the same park plays differently in April than in August because of temperature and humidity. The desk rule: use the park factor as a starting point, then adjust for the conditions of the actual day. A Coors Field game in 45-degree April rain is closer to neutral than the season-long Coors factor would suggest.
The Five Most HR-Friendly Parks in 2024–2026
The first time I looked at a Dodger Stadium total and saw an over priced at 1.85, I assumed someone at the bookmaker had got it backwards. Turns out they hadn’t — the market was just slow to acknowledge how much more hitter-friendly the park has become in the rolling 2024–2026 sample. The top of the HR-park leaderboard has shifted in ways that still trip up casual punters working from outdated reputations.
Dodger Stadium leads the league with an HR Park Factor of 129. That is the new structural fact, and it is one of the most meaningful park-factor changes in recent memory. The combination of marine layer dynamics, the renovation history, and consistent warm dry summer evenings has made Chavez Ravine the most reliable home-run venue in the major leagues.
Great American Ball Park in Cincinnati sits at 122 — second-most HR-friendly. Cincinnati has held this position consistently for years. The dimensions, the warm Ohio Valley summer, and the way the wind tends to blow toward the Ohio River side make this a power-hitter’s park nearly every game. The trade here is rarely the over on the total — that is too well-priced — but rather the HR props on individual hitters with rising Barrel Rate.
The next three positions on the leaderboard fluctuate across seasons but typically include Coors Field, Yankee Stadium, and Citizens Bank Park. Coors carries the altitude effect. Yankee Stadium has the famous short right-field porch. Citizens Bank in Philadelphia is a smaller-than-average outfield with a hot summer climate. The common feature is that the surface reputation matches the underlying factor — these are venues where over bets and HR props are aggressively priced, which means available edge is smaller.
The interesting trade in the top tier is the road series. When a power-heavy lineup travels into one of these parks, the casual punter assumes the over is automatic. The market knows this and shades accordingly. The actual edge often lies in the run-line for the home team — heavy hitter-friendly parks favour multi-run wins, and the structural pricing on –1.5 in those venues is more attractive than the over on the total.
For the deepest dive into the unique altitude dynamics of one specific top-tier venue, the dedicated Coors-altitude case study picks up where this overview ends.
The desk rule for HR-friendly parks: trust the factor for HR props, fade the consensus on the totals, and look at the run line as the cleaner trade when the matchup pairs a hitter-friendly park with a strong offensive home team.
Pitcher-Friendly Parks: Where Totals Should Drop
Oracle Park in San Francisco is the cleanest pitcher’s park in baseball, and the number that proves it is brutal. HR Park Factor of 77 in the rolling 2024–2026 sample. That means home runs at Oracle happen 23 per cent less often than the league baseline. The combination of the marine layer, the cold San Francisco evenings, and the deep dimensions in right-centre kills fly-ball power in a way that no other park in the majors does consistently.
The under crowd loves Oracle Park, and the bookmakers have priced that in. The total typically opens lower than league average and rarely moves significantly. That makes the structural under bet a low-edge play. Where the value actually lives at Oracle is in player props for visiting hitters — total bases, hit props, HR props — where the market often prices the hitter’s overall season-long performance without adequately discounting for the venue. Pitcher props go the other way, with strikeout totals and quality-start markets often presenting positive expected value.
PNC Park in Pittsburgh sits at 78. PNC is a beautiful park with a short right-field wall that occasionally fools casual punters into thinking it should be a hitter’s park. It isn’t. The deep left-centre dimensions, the cool evenings along the Allegheny River, and the way the ballpark sits open to wind off the rivers consistently suppress run production. The underlying numbers have stayed stable across the past five years.
Busch Stadium in St. Louis sits at 81. Busch is the most surprising park on the pitcher-friendly leaderboard for many UK punters because the climate is hot and humid, which intuitively should help offence. The dimensions and the way the air settles in the bowl in mid-summer evenings tell a different story. Run production at Busch is consistently below league average, particularly in night games where the temperature drops faster than expected.
The trade pattern across these parks is consistent. The under on the total is well-priced and rarely offers serious edge. The actionable trades are in the props and the run lines. Visiting hitters with strong overall numbers but weak handedness splits get particularly harsh treatment in Oracle and PNC — fading them on hit props is a small, repeatable edge across a season.
One operational caveat. Pitcher-friendly parks reward starters who already pitch to contact and induce ground balls. They punish high-fly-ball pitchers who rely on swing-and-miss to limit home runs. Pairing the park factor with the starter’s batted-ball profile is what turns a generic “under at Oracle” trade into a more precise one.
Wind Direction: The Wrigley Field Multiplier
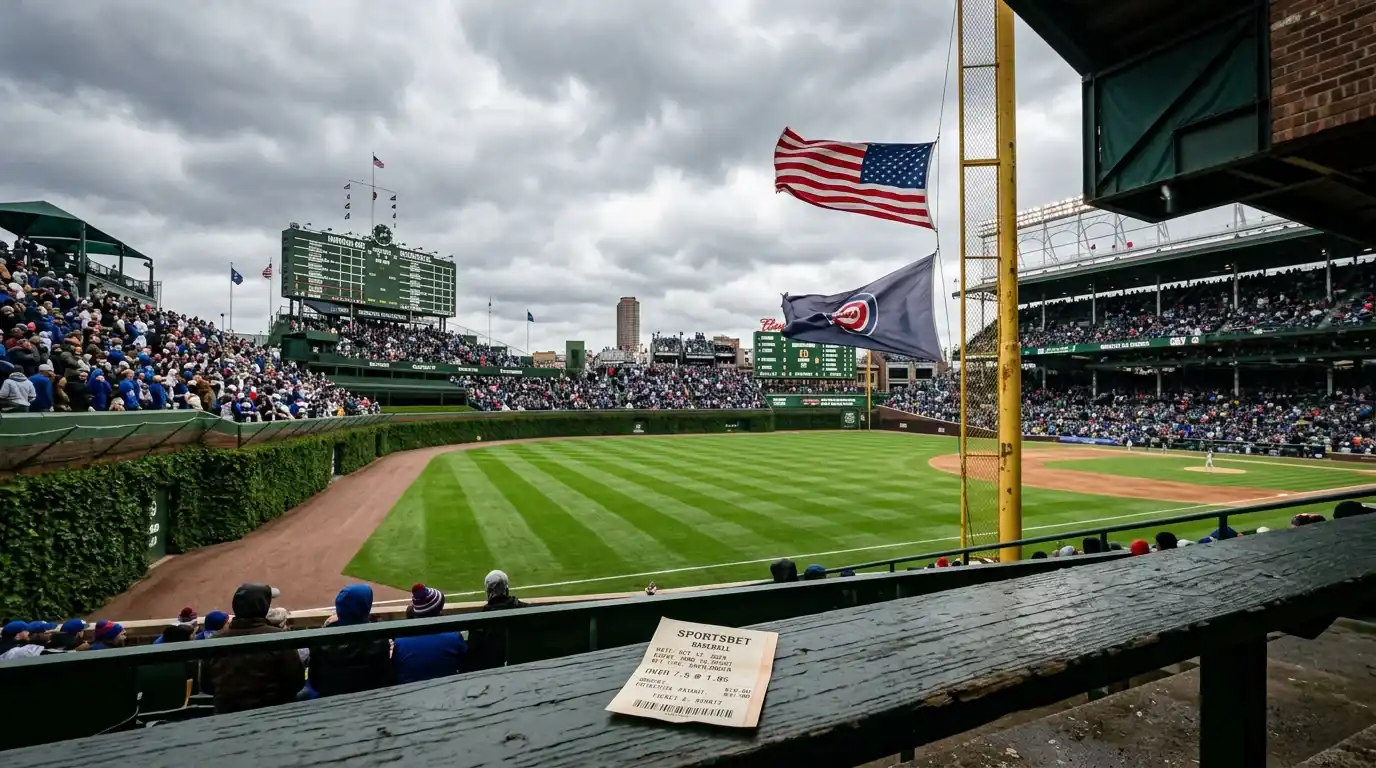
The single most volatile weather variable in MLB betting is the wind at Wrigley Field, and the data on it is genuinely shocking the first time you see it. With wind of 10 mph or more blowing out, home runs at Wrigley increase by roughly 50 per cent. Wind blowing in at less than 10 mph drops home runs by 33 per cent. Same park, same dimensions, same hitters and pitchers — three completely different game environments depending on what the breeze is doing off Lake Michigan.
The mechanism is not subtle. Wrigley sits in an unusual urban geography where the buildings to the south block and channel airflow in ways no other major-league park experiences. The wind tends to come predominantly from one of two directions, and the effect on fly balls is almost binary. A ball hit 360 feet that would land in a routine catcher’s mitt on a calm day clears the basket on a wind-out day. The same ball gets caught at the warning track when the wind shifts.
The league-wide picture confirms that Wrigley is unusual but not unique. Across all parks, when wind blows toward left field, team runs go up by 5.8 per cent and home runs by 7.6 per cent compared with the average. Gusts of 16 mph or more lift the home-run figure to a 10.7 per cent increase. Wrigley is simply where the effects are amplified beyond proportion to anything else in the league.
The practical workflow for Wrigley games is unlike any other park. I check the wind forecast at first pitch, not the game-time temperature. Wind direction matters more than wind speed up to about 15 mph; above that, speed starts to dominate. A 12 mph wind blowing straight out is a higher home-run environment than a 20 mph wind blowing diagonally.
The market typically prices Wrigley wind, but not perfectly. Bookmakers adjust totals by half a run to a full run on extreme wind days, but the adjustment usually trails the actual effect. On confirmed wind-out days with sustained 12-plus mph winds, the over has been historically positive expected value across the past five seasons. On confirmed wind-in days, the under has been similarly positive.
One caveat worth keeping in mind: the wind forecast at game time can differ from the wind during the game. Late-afternoon games at Wrigley sometimes start with one wind direction and end with another, particularly in spring and autumn when the lake-effect can flip in the seventh or eighth inning. For first-five-innings bets, the early-game wind dominates and the back-half flip doesn’t matter.
The desk rule for Wrigley: wind direction is the single most important pre-match input at this venue, and it overrides the season-long park factor on extreme days.
Temperature, Humidity and Ball Carry
The first thing I tell anyone learning weather work for MLB betting is that temperature matters more than humidity, and humidity matters in the opposite direction from what most people assume. Hot, dry air actually carries the ball further than hot, humid air. The reason is density — humid air is less dense than dry air at the same temperature, so a baseball encounters less drag, but the effect on lift is smaller than the effect on backspin generation off the bat.
The rough rule that holds across most parks is that every 10 degrees Fahrenheit increase in temperature adds roughly 2 to 4 feet of carry to a well-struck fly ball. That doesn’t sound dramatic until you remember that the wall is the same distance away regardless of the weather, and a 380-foot warning-track flyout becomes a 384-foot home run. The marginal cases are where temperature swings the result.
The seasonality this creates is something I track on every park. April and May games at northern parks like Detroit, Cleveland, and Boston play colder than the season-long park factor suggests, so the over is harder to cash. July and August at the same parks play warmer and the same park factor underrates the offence. The Statcast park factor is a year-round average — splitting it by month gives you a sharper read for any specific game.
Humidity gets oversold in casual analysis. The actual effect on ball carry is small in the typical 40–80 per cent range. Where humidity matters more is in pitcher grip and breaking-ball quality, which affect strikeout rates rather than fly-ball distance. A humid 90-degree afternoon in Houston isn’t producing more home runs because of the humidity — it is producing more contact because the breaking balls don’t move as sharply. Different mechanism, similar end result for totals.
The practical synthesis: I add temperature to my park-factor read in 10-degree bands. League average summer baseball is roughly 75 degrees Fahrenheit. Games at 85-plus degrees are noticeably more offensive across the league regardless of park. Games below 60 degrees suppress offence by a noticeable margin even at hitter-friendly venues. The desk rule: when the temperature deviates more than 15 degrees from the seasonal norm at the venue, treat the park factor as adjustable rather than fixed for that day.
Domes, Retractable Roofs and Pace-of-Play
Dome games are baseball without weather. That sounds like a simplification — and it is, but it is also exactly the point. When the roof is closed, every variable I have spent five sections discussing becomes a constant. Temperature is whatever the climate control is set to, humidity is stable, wind is zero. The park factor at a closed-roof venue is basically the only environmental input you need.
The retractable-roof venues — Houston’s Minute Maid Park, Phoenix’s Chase Field, Toronto’s Rogers Centre, Miami’s loanDepot park — present a more interesting case. The roof status changes by game and even by inning at some venues. A roof-open game at Minute Maid in April afternoon plays differently from a roof-closed game at the same venue in the same week. The relevant park factor for these venues is essentially two different numbers depending on roof status.
The pitch-clock context matters here, particularly at dome and retractable-roof venues. The clock changed pace of play and run environment in measurable ways — average runs per game in MLB rose from 8.6 to 9.2 after the rule was introduced, and stolen-base attempts climbed from 1.4 to 1.8 per game. Morgan Sword, MLB’s Executive Vice President of Baseball Operations, observed that the league had spoken to minor-league players and coaches about the impact of shortened games and that the early concerns about a quicker pace causing arm injuries had not materialised — if anything, injuries were down a touch. For dome venues with consistent climate, the pace-of-play change is unambiguously offensive — there is no weather variable diluting the effect.
The trade pattern at dome and roof-closed venues is straightforward. The under is easier to model because the variables collapse. The over is easier to take confidently because there is no rain risk. Pace is faster on average than open-air games because there are no weather delays. For UK punters working from a London time zone, dome games are also the most reliable in-play markets — no rain delays at 3am.
One operational note for retractable-roof venues. The roof status is sometimes announced shortly before first pitch and can change between then and game time. UK books typically settle on the roof status at first pitch. If you have placed an over expecting an open roof and the team closes it for unexpected weather, your bet is suddenly working against a different environment. The desk rule: for retractable-roof games, check the roof status at game time, not the morning before.
Stay updated with the latest stadium reports and expert picks at the top MLB betting analysis platform for British punters.
A Pre-Match Weather-and-Park Routine for UK Bettors
What does this look like at half past nine on a UK weeknight, before the first MLB game of the evening? My routine has six steps and takes about five minutes per game.
Step one, thirty seconds: pull the venue’s HR and run park factors. I keep a one-page reference of all 30 parks with their rolling 2024–2026 factors, so this is almost instant. Anything within five points of league baseline (95–105) is a neutral park environment that I can mostly ignore. Anything outside that band gets a closer look.
Step two, one minute: check the day-of-game weather forecast for first pitch. Three numbers matter: temperature, wind direction, and wind speed. I use the National Weather Service forecast for the game-time hour at the venue’s coordinates — more granular than the generic city forecast.
Step three, one minute: decision tree on wind. If wind is below 6 mph, ignore. If wind is 6–10 mph, note the direction but treat as marginal. If wind is 10-plus mph, this becomes a primary input. At Wrigley specifically, wind 10-plus mph blowing out is a 50 per cent HR boost. Wind 16-plus mph toward left field is a league-wide 10.7 per cent HR increase that the market underprices about half the time.
Step four, thirty seconds: temperature adjustment to the park factor. League-average summer baseball is roughly 75 degrees Fahrenheit. Adjust the park factor up by roughly 5 points for every 10 degrees above 75, down by 5 points for every 10 degrees below.
Step five, one minute: dome and roof check. If the venue has a retractable roof, find out the roof status. If closed, weather variables collapse. If open, treat as an open-air park.
Step six, one minute: synthesise into a totals read. Park-and-weather neutral — no signal, the bet is decided on pitching and lineup factors alone. Park-and-weather pro-offence — the over has a structural lean. Park-and-weather pro-pitching — the under has a structural lean. The discipline is treating the park-and-weather signal as an input alongside the pitching and lineup, never as the only input.
Worked Example: A Wrigley Wind-Out Total
Let me walk through a Wrigley game the way I priced one in early summer last year. The venue is Wrigley Field. The forecast at first pitch is 78 degrees Fahrenheit, wind out of the south-west at 13 mph blowing toward right-centre field. The total has opened at 8.5, with the over at 1.95 and the under at 1.95.
The first input is the structural Wrigley wind effect. With wind blowing out at over 10 mph, home runs at this venue increase by roughly 50 per cent over a calm-air baseline. That is a known-and-published structural fact, not a probabilistic guess. The market knows this too, so the question is whether the half-run total adjustment that the bookmaker has made is enough to fully price the wind effect.
The second input is the temperature. 78 degrees is slightly above league-average summer baseball, which adds maybe 1–2 feet of carry to a well-struck ball. Marginal but additive to the wind effect.
The third input is the matchup. Both starters are mid-rotation arms with FIP in the 4.10–4.30 range. Both lineups are middle-of-the-pack offensive teams with lineup wOBA around .315. Pitching neutral, lineup neutral. The matchup is not adding a structural over signal independent of weather.
The fourth input is the bullpen quality on both sides. Both bullpens running 30-day ERA in the high 3s — neutral. No red flags either direction.
The synthesis: park-and-weather is the dominant signal in this game. The matchup is otherwise neutral, which means the over has a structural lean from the wind alone. The total at 8.5 may already be elevated above the no-wind baseline. The question becomes how elevated. My historical tracking on Wrigley wind-out games with sustained 12-plus mph winds is that the actual total has averaged about 1.2 runs higher than the bookmaker’s adjusted line. That suggests the over at 1.95 is positive expected value.
The trade I take is the over 8.5 at 1.95 with my standard £25 stake. Implied probability at 1.95 is 51.3 per cent. My read of the matchup, factoring the wind, puts the actual over probability closer to 56–57 per cent. The edge is real but not enormous. I take it because the wind signal is structural rather than probabilistic — the wind effect is a known repeatable phenomenon with five years of data behind it.
The discipline check at the end: I do not stake more because the analysis “looks strong.” Stake stays at £25. Wrigley wind-out games have produced positive expected value across my tracking, but they also produce variance. Some games go 4-3 even with the wind out. The flat stake commitment is what keeps the variance survivable.
Park-and-Weather Questions UK Bettors Ask
Three questions come up over and over from UK punters working through park-and-weather analysis for the first time.
The highest-HR-park question gets asked most. In the rolling 2024–2026 sample, Dodger Stadium leads the league with an HR Park Factor of 129 — ahead of even Coors Field on current data, which surprises many punters who learned the Coors-altitude story years ago. The structural lead has been consistent across the past three seasons.
The Wrigley wind question is the second most common. With wind of 10 mph or more blowing out, home runs at Wrigley increase by roughly 50 per cent over a calm-air baseline. Wind blowing in at less than 10 mph cuts home runs by 33 per cent. Same park, completely different game environment depending on what the wind is doing off Lake Michigan. The bookmakers price this, but typically not fully on extreme wind days.
The retractable-roof question matters because punters expect domes and retractable-roof venues to behave identically. They don’t. A closed retractable roof produces a near-identical environment to a dome — temperature stable, no wind, no humidity variance. An open retractable roof produces an environment closer to an outdoor park with the local climate. Treat retractable-roof venues as two distinct venues with different park factors for each.
Which MLB ballpark has the highest home-run park factor in 2026?
Dodger Stadium leads the league with an HR Park Factor of 129 in the rolling 2024–2026 Statcast sample, meaning home runs there happen about 29 per cent more than the league baseline. This places Dodger Stadium ahead of Great American Ball Park in Cincinnati at 122 and ahead of even Coors Field on the current data. The lead has been consistent across three seasons and reflects the combination of climate, dimensions, and marine-layer dynamics specific to the venue.
How much does the wind at Wrigley Field actually change scoring?
With wind of 10 mph or more blowing out, home runs at Wrigley Field increase by approximately 50 per cent over a calm-air baseline. Wind blowing in at less than 10 mph cuts home runs by 33 per cent. The effect is unique to Wrigley among major-league parks because of the venue’s urban geography and the way air flows off Lake Michigan. League-wide effects are smaller — wind toward left field lifts team runs by 5.8 per cent and home runs by 7.6 per cent — but Wrigley amplifies the standard effect dramatically.
Do retractable-roof games behave like dome games for totals betting?
Yes when the roof is closed, no when the roof is open. A closed retractable roof produces a near-identical environment to a dome — stable temperature, no wind, no humidity variance, predictable run environment. An open retractable roof produces a normal outdoor-park environment with the local climate fully in play. The roof status at first pitch is what the bookmaker uses to settle weather-affected markets. Always check the roof status at game time, not the morning before, since it can change with weather forecasts.
Geography Sets the Number, You Read It
The frame I keep returning to with park-and-weather work is that geography is doing half the analysis before the players step on the field. The pitcher and the hitter matter, the bullpen matters, the line on the day matters — but they are all happening inside a venue that is structurally biasing the run environment in one direction or another.
The discipline that turns this into profit, rather than into trivia, is treating the park-and-weather signal as one input alongside others. Not the only input, never the dominant input, but never an afterthought either. When the park, the weather, and the pitching matchup all point the same direction, that is when the price is genuinely lagging the matchup. Those are the bets that compound over a season.
Prepared by the Betting on Baseball Tips editorial staff.